Fabian Becker, Daniel Moser, Armin Wagner
March 2026
As fuel prices skyrocket and supply chains fracture, the transport sector faces a fundamental challenge: how to decouple economic activity from oil consumption overnight.
In this context, the term “demand destruction” refers to a sustained reduction in the consumption of a commodity caused by economic pressures such as high prices, supply shortages, or structural changes in technology and behavior.
Market driven demand destruction occurs when high prices or supply risks force consumers and businesses to reduce fuel use. In the short term, this adjustment can be disruptive because mobility and transport become more expensive and some economic activities are postponed or completely abandoned. At the same time, price signals also stimulate innovation and substitution. Rising fuel costs encourage efficiency improvements, operational optimization, and the search for alternatives, from more efficient logistics and shared mobility to electrification and digital substitution.
Constructive demand destruction builds on these same dynamics but guides them proactively. Instead of waiting for crises to force adjustments, policymakers and institutions deploy targeted measures such as bus priority lanes, eco-driving programs, freight consolidation, rail substitution for short haul flights, or hybrid work policies. These measures reduce oil intensity while maintaining mobility and economic activity.
In practice, the two mechanisms can reinforce each other. Market signals reveal where oil dependence is costly, while constructive measures help accelerate the transition toward more efficient and sustainable mobility systems.
For countries that subsidize transport fuels, proactive demand reduction becomes even more important. When global oil prices rise, governments that cap retail fuel prices must absorb the difference through the public budget. Without measures to limit demand growth, subsidy costs can quickly escalate and create significant fiscal pressure. Improving efficiency and reducing oil intensity in transport therefore helps governments stabilize subsidy expenditures while maintaining affordable mobility for households and businesses.
The following table presents 16 options for immediate oil demand destruction, specifically tailored to the ongoing 2026 Strait of Hormuz crisis. These measures focus on “Constructive Demand Destruction” to mitigate the massive supply gap of around 21 million barrels per day (total demand around 100 mln barrels per day).
16 Measures for Immediate Oil Demand Destruction
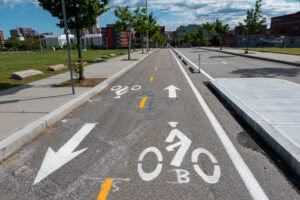
Two-way separated bicycle ped lane on Clifford Street in Providence, Rhode Island. Installed either late 2019 or early 2020.
Measure 1: Pop-up Bike Infrastructure
Rapid tactical bike lanes expand low-energy travel options.
Pop-up bike lanes in Bogotá and Tirana were introduced in 2020 to rapidly expand safe cycling space. Bogotá installed over 80 km of emergency lanes to support mobility and relieve pressure on its TransMilenio BRT system. Tirana implemented 11 km of temporary bike lanes and wider sidewalks. The projects showed how quick infrastructure adjustments can enable low-energy urban travel options.
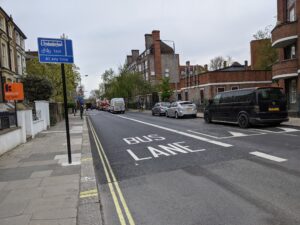
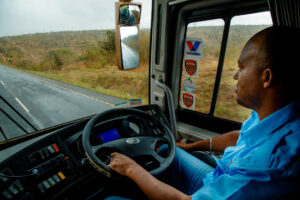
Measure 2: Bus Priority Lanes
Dedicated bus lanes improve transit speed and reliability while increasing transport & energy efficiency.
Bus priority lanes have been implemented in many cities as a rapid and cost-effective measure to move more passengers with fewer vehicles. By reducing stop-and-go traffic and improving flow, buses operate more efficiently and consume less fuel per passenger. The result is a shift toward higher-occupancy transport modes and lower overall energy use in urban mobility.

Measure 3: Moderate Speed Optimization
Lower highway speeds improve vehicle efficiency and traffic flow.
Moderate highway speed management has been used to improve efficiency and reduce emissions. In 2020 the Netherlands introduced a 100 km/h daytime motorway speed on most highways. The measure aimed to quickly reduce pollution and fuel use while maintaining reliable travel. Lower speeds also improve vehicle efficiency by reducing aerodynamic drag.

Polizisten kontrollieren Autos auf der Eckernförder Straße, Ecke Sylter Bogen in Suchsdorf. Nur Autofahrer mit einer Sondergenehmigung fahren.
Measure 4: Car-Free Sundays
Temporary street access changes encourage active mobility.
Car-free Sundays in Germany and Switzerland were introduced during the 1973 oil crisis to conserve fuel. For several Sundays, private car traffic paused while public transport, cycling, and walking continued. Traffic volumes and fuel consumption dropped dramatically during the events. The initiative demonstrated how temporary street access changes can quickly reduce oil demand.

Measure 5: Work-from-Home Programs
Remote work reduces commuting trips and congestion.
Work-from-home programs expanded globally during since early 2020s, enabling employees to perform many tasks remotely. The shift significantly reduced daily commuting and peak-hour congestion. Many organizations continue to offer hybrid work schedules several days per week. Remote work shows how digital tools can maintain productivity while reducing transport energy demand.
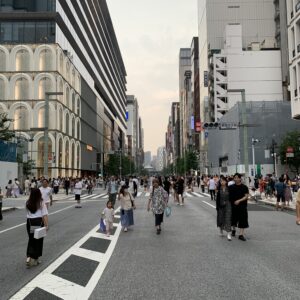
Measure 6: Open Streets Programs
Temporary road closures prioritize walking and cycling.
Open Streets initiatives temporarily dedicate major roads to walking and cycling. Bogotá’s long-running Ciclovía opens more than 120 km of streets every Sunday to active travel. Similar programs expanded globally during the pandemic to support outdoor mobility. These events demonstrate how flexible street use can encourage low-energy transport choices.
Measure 7: High-Occupancy Commuting
Carpooling increases passengers per vehicle.
High-occupancy vehicle lanes in the United States encourage shared commuting on busy corridors. Cities such as Los Angeles and Washington, DC reserve lanes for vehicles carrying two or more passengers. The approach rewards shared travel with faster and more reliable trips. Higher vehicle occupancy significantly improves fuel efficiency per passenger.
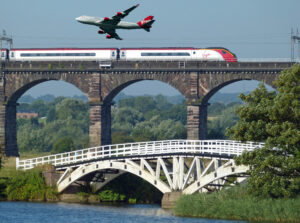
Measure 8: Domestic Aviation Pivot
Rail substitutes short-haul aviation where feasible.
France introduced measures in 2023 encouraging travelers to shift from short flights to rail. Flights are no longer scheduled on routes where a direct train connection under 2.5 hours exists. Travelers are encouraged to use the country’s extensive high-speed rail network. Rail travel typically uses far less energy per passenger than aviation.
Measure 9: Eco-Driving & Anti-Idling
Efficient driving improves fleet fuel economy.
Eco-driving programs encourage smoother acceleration, optimal speeds, and reduced engine idling. Countries including Japan and the United Kingdom have introduced driver training programs for commercial fleets. Combined with anti-idling practices, these measures significantly improve fuel efficiency. Efficient driving also reduces operating costs for transport companies.
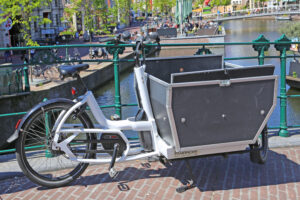
Measure 10: Urban Freight Consolidation
Shared logistics hubs reduce duplicate delivery trips.
Urban freight consolidation hubs coordinate deliveries from multiple suppliers before entering dense city areas. Cities such as London and Paris have piloted consolidation centers linked with cargo bikes and small electric vans for last-mile delivery. The approach reduces duplicated delivery trips. It improves logistics efficiency and reduces fuel demand in dense corridors.
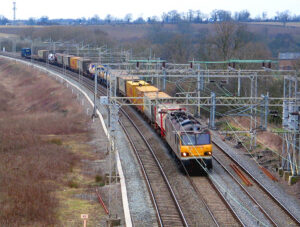
Measure 11: Strategic Road-to-Rail Freight
Rail replaces diesel trucking on long corridors.
Rail freight corridors provide an efficient option for moving goods over long distances. Countries including Germany, China, and the United States rely on rail to connect major logistics hubs. Rail transport requires far less energy per ton-kilometer than trucking. Expanding rail utilization strengthens supply chains while reducing diesel demand.

Measure 12: Plate Rotation Traffic Management
License-plate rules manage congestion during supply shocks.
License-plate rotation systems allocate road access based on plate numbers. Cities such as Beijing and Mexico City have implemented odd-even plate systems during congestion or pollution episodes. The approach helps stabilize traffic flows and reduce peak-hour vehicle volumes. During implementation periods it can significantly lower private vehicle traffic.
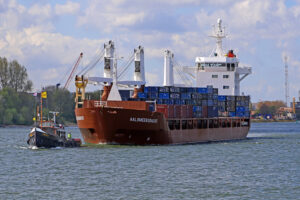
Measure 13: Maritime Slow-Steaming
Slower ship speeds reduce marine fuel consumption.
Slow-steaming reduces the operating speed of cargo ships to improve fuel efficiency. The practice became widespread after the 2008 financial crisis as shipping companies optimized routes and vessel speeds. Lower speeds reduce engine load and hydrodynamic resistance. Shipping companies continue using the strategy to improve efficiency and manage fuel costs.

Measure 14: Corporate Travel Optimization
Digital collaboration replaces business travel.
Digital collaboration platforms have transformed business communication. Since 2020, companies widely adopted remote meetings and hybrid work practices. Virtual collaboration allows organizations to maintain productivity without frequent travel. The shift significantly reduces demand for corporate aviation and long-distance travel.
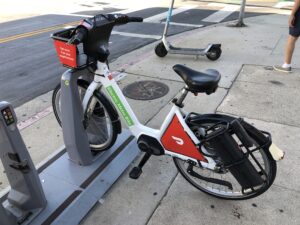
Measure 15: Micromobility & E-Transit
E-bikes and scooters replace short car trips.
Cities worldwide are supporting electric bikes, scooters, and light electric vehicles. Programs in cities such as Paris and Madrid provide purchase subsidies or shared micromobility systems. These vehicles are highly efficient for short urban trips. Micromobility offers a low-energy alternative for first- and last-mile travel.
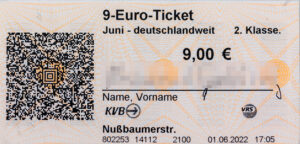
Measure 16: Cheaper Public Transport
Public Transport replaces Car Trips.
Germany’s 9‑euro ticket was a three‑month special public transport pass in summer 2022 that allowed unlimited use of public transport across the whole country for 9 euros per month (June, July, August).
It was introduced as a temporary measure to ease the cost‑of‑living and energy‑price crisis after Russia’s invasion of Ukraine and to promote climate‑friendlier mobility by making public transport more attractive.
In the medium to long term, deeper reductions in oil demand will depend on structural changes across the transport and energy systems. Continued improvements in energy efficiency, the electrification of mobility, and the substitution of fossil fuels with renewable energy sources will play a central role. Investments in public transport, rail infrastructure, digital mobility services can further reduce oil intensity while supporting economic growth.
Further reading:
- IEA: Insights series 2018 – Saving Oil in a Hurry – Analysis – IEA
- IEA: Oil Market Report – March 2026 – Analysis – IEA
- SUTP: SUTP Module 5h – Urban Transport and Energy Efficiency – SUTP
- TUMI: Crisis Management in Urban Transport Systems
Picture sources:
- By Kenneth C. Zirkel – Own work, CC BY-SA 4.0, https://commons.wikimedia.org/w/index.php?curid=91198390
- By Camden Cyclists – https://www.flickr.com/photos/camdencyclists/51179425014/, CC0, https://commons.wikimedia.org/w/index.php?curid=148374093
- By formulanone from Huntsville, United States – 100 km/h Sign, CC BY-SA 2.0, https://commons.wikimedia.org/w/index.php?curid=68514914
- By Magnussen, Friedrich (1914-1987) – Stadtarchiv Kiel, CC BY-SA 3.0 de, https://commons.wikimedia.org/w/index.php?curid=69380246
- By Oregon Department of Transportation – Remote work, CC BY 2.0, https://commons.wikimedia.org/w/index.php?curid=133507668
- By ARandomName123 – Own work, CC BY-SA 4.0, https://commons.wikimedia.org/w/index.php?curid=150061068
- By Original: California Department of TransportationVectorization: User:Fluffy89502 – http://www.dot.ca.gov/trafficops/tcd/docs/G92-1.pdf, Public Domain, https://commons.wikimedia.org/w/index.php?curid=79996742
- By ARG_Flickr – https://www.flickr.com/photos/38986305@N06/14560114137/ , CC BY 2.0, https://commons.wikimedia.org/w/index.php?curid=115030081
- By Rasheedhrasheed – Own work, CC BY-SA 4.0, https://commons.wikimedia.org/w/index.php?curid=64320035
- By W. Bulach – Own work, CC BY-SA 4.0, https://commons.wikimedia.org/w/index.php?curid=80303927
- Public Domain, https://commons.wikimedia.org/w/index.php?curid=102307
- By Jakub CA – Own work, CC BY-SA 4.0, https://commons.wikimedia.org/w/index.php?curid=132409059
- By W. Bulach – Own work, CC BY-SA 4.0, https://commons.wikimedia.org/w/index.php?curid=117840928
- By Ting Jingrang – Own work, CC BY-SA 4.0, https://commons.wikimedia.org/w/index.php?curid=107639839
- By Facewizard – Own work, CC BY 4.0, https://commons.wikimedia.org/w/index.php?curid=152480392
- By VRS – Scan by Raimond Spekking, Public Domain, https://commons.wikimedia.org/w/index.php?curid=120629257